
Here at Futr, we like to think of our Analytics section of the platform as the umbrella which sits above our key functionalities (Automate, Integrate, Live Chat and Reach). We do all the hard work, by pulling the data from your chatbots, so you can review it, understand the cost savings, value and make informed, data-driven decisions.
Dashboards #
Our dashboards sit both on an organisation and bot-specific level, where you can find all metrics and data pulled from your chatbot. You can configure the data to align with the past 7 days, 28 days or alongside a custom date range for an in-depth review.
Each piece of data is downloadable in the dashboard. This enables you to take a more granular approach to data review and focus on a specific section. You are able to export this as CSV or JSON file.
You can navigate through each tab, and analyse data associated with different features of your chatbot. Below is an explanation of each tab included in the dashboard:
Users #
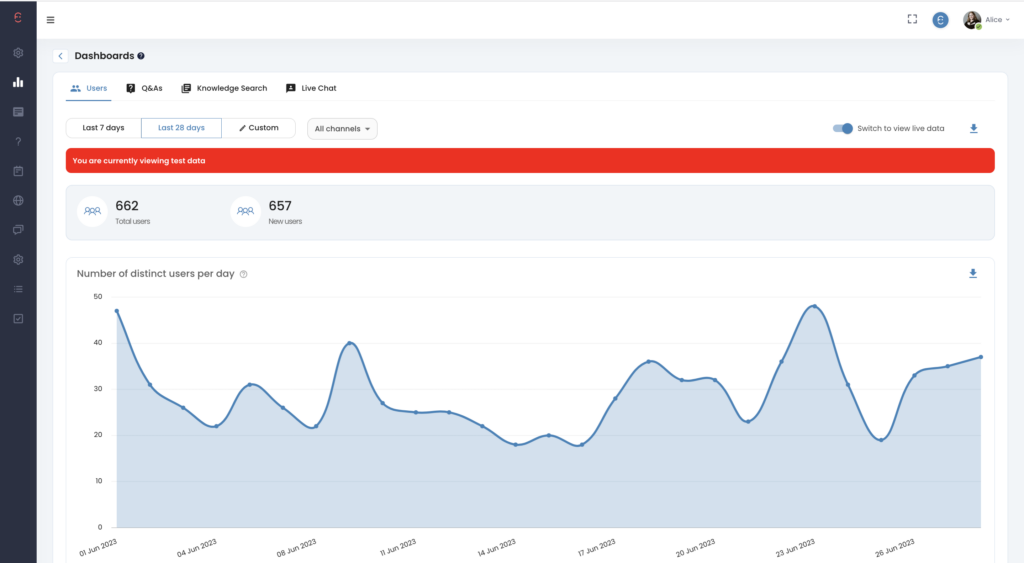
The Users tab in the Dashboard displays all metrics associated with user interactions in your Chatbot. It shows you Total Users and New users which can give you an understanding of overall engagement but also allows for an insight into repeat users.
The user’s tab also includes the Number of distinct users per day, User feedback per day, which is the data collected from the end of chat survey, Daily Activities, Users per Channel, Users per language, User sentiment and number of messages per time of day.
The Users tab gives you a deeper insight into not only who is using your chatbot, but when they are using it. By understanding your peak times, you can then organise resources appropriately.
Q&A #
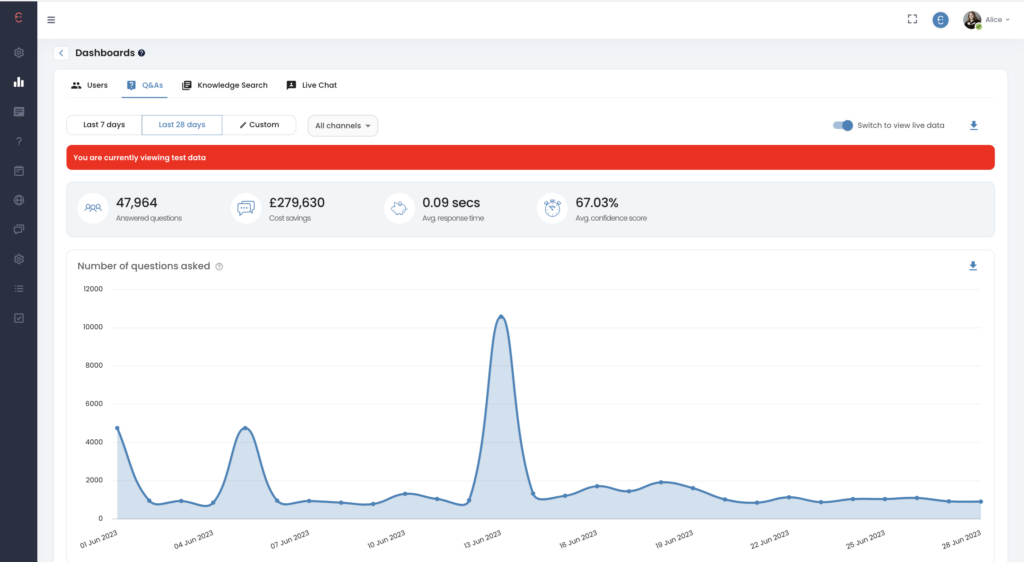
The Q&A tab involves all things Automate. Is it the place where you can see your ROI and collect data which can influence your next steps surrounding content in your chatbot.
Breakdown of Metrics
- Answered Questions:
- These are all the answered questions your chatbot has answered in the selected time frame.
- Cost savings:
- This is a numerical figure generated using Gartner’s study that each customer contact is a cost saving of £5.83 (If you have your own figure, we can use this!).
- Average Response time:
- The time in which your chatbot responded to your user.
- Average confidence score:
- This is an overall percentage of the confidence scores given to your answers.
- Most popular questions asked:
- This is a great part of the Q&A tab because it informs you of what is most topical amongst your users, you can then make a decision on adding more content and changing your featured questions.
- Unanswered Questions:
- This allows you to sieve through and review what is not being answered by your chatbot and possible reasons why. Any questions which are not relevant you can delete, but questions which you would like to be in your library you can instantly add them by creating a new question or associating them with an existing question.
Knowledge Search #
- Knowledge search shows your Number of Policy Searches, Most popular searches and most popular policies. This gives you an insight into what your users are searching and you can then create more content in your Q&A library surrounding these topics.

Live Chat #
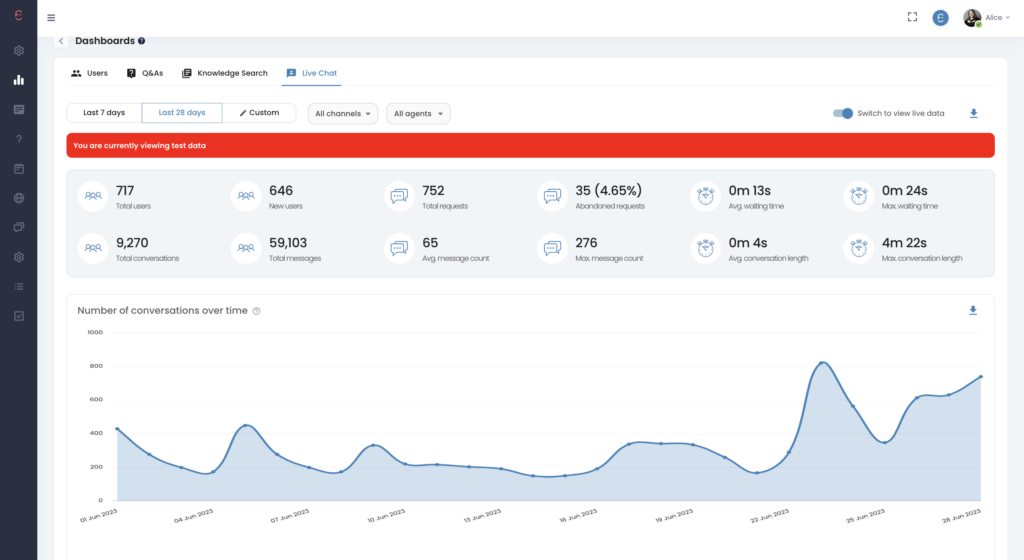
- Live Chat includes an in-depth review of all conversations had by your Live Chat agents and the metrics associated with them.
Breakdown of Metrics
- Total Users:
- Total users who have utilised the Live Chat feature
- New Users:
- The number of users who have not used the Live Chat before (You can compare this to total users and see how many repeat users your chat has had).
- Total Requests:
- The number of requests sent through to speak to a Live Agent.
- Abandon Requests:
- The number of users who have clicked off the Live Chat, before being connected to an Agent.
- Avg, Waiting Time:
- The average time a user has waited before being connected to an Agent.
- Max Waiting Time:
- The maximum time spent by a user, waiting to be connected to a Live agent.
- Total Conversations:
- The total number of conversations between your users and Live Agents.
- Total Messages:
- The total number of messages exchanged between your users and Live Agents.
- Avg. Message Count:
- The average number of messages exchanged per interaction.
- Max. Message Count:
- The maximum number of messages exchanged between users and Live Agents.
- Avg. Conversation Length:
- The average conversation length between your users and Live Agents.
- Max Conversation Length:
- The maximum conversation length had between a user and Live Agent.